
Quicksuite Knowledge Base Get Support 24/7
Sales Report
Quicksuite’s Sales Report Feature is your comprehensive tool for gaining insights into your sales performance and driving informed business decisions. With this powerful feature, you can analyze sales data, track trends, and identify growth opportunities. The sales report feature of the admin panel lets the admin view the sales report according to different sections such as online revenue, cash revenue, orders, and products to name a few.
The online revenue section shows the revenue earned from online payments such as UPI transactions and card payments. The admin can also change the view of the section from graph view to table view and vice-versa. Alongside the change view button, a date filter is also present that helps the admin to select a date from the drop-down menu.
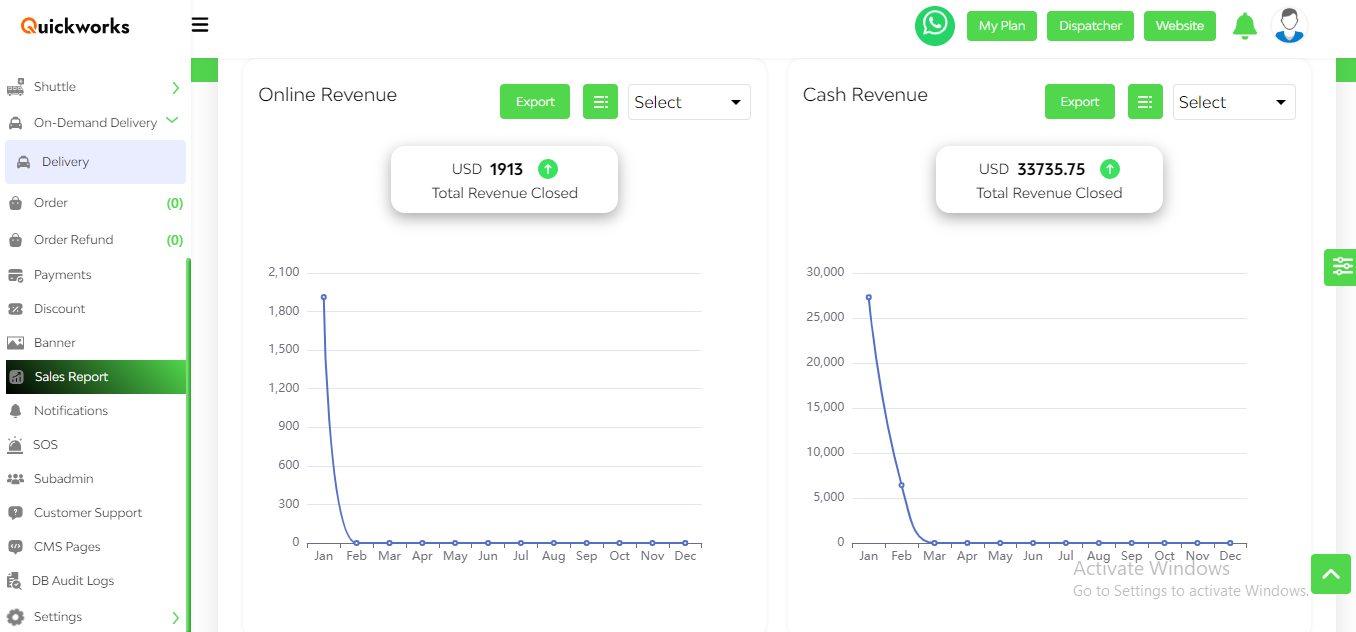
The cash revenue section shows the revenue earned from cash payments. Similar to the online revenue section, the change view button and a date filter are also present in the cash revenue section.
The orders section of the sales report shows various details of an order like its created date, its sales price, the commission of the admin, and the merchant’s revenue on that particular order. The order section has two different date filters, one to view orders between two specific dates and one to choose dates from the drop-down menu. The admin can select a particular store from the select store button to view the order details of that store. The admin can also export details of all the orders to an Excel file using the export button.
The product section of the sales report feature allows the admin to view various insights about the products offered by the merchants. Various details like the name of the product, the number of times the product has been ordered, denoted by the count tab, the rating provided by the consumers, and the merchant’s revenue are displayed. Similar to the order section, two date filters, a store select button, and an export button are present.
The category section allows the admin to view a monthly report of all the categories. The section includes details like the name of the category, the number of times that specific category was ordered, referred to as count, and the revenue earned by sale. The admin can also use the date filter to get insights between two specific dates. The admin can select a particular date by clicking on an option from the drop-down menu. The admin can also export the data in an Excel file format by clicking on the export button.
The sub-category section allows the admin to view a monthly report of all the sub-categories. The name of the sub-category, the number of times that specific sub-category was ordered, referred to as count and the revenue earned by sale of each sub-category are present in this section. Similar to the category section, the admin can employ the date filter for insights within chosen dates. By selecting from a dropdown, specific dates can be chosen. Additionally, clicking on the export button allows the admin to save the data as an Excel file.
The merchant section shows the admin all the details of merchants like their names, the number of orders that have been placed from a particular merchant, referred to as count, and the revenue generated by a merchant, denoted by sale. The admin can employ the date filter to gain insights within defined date ranges. By choosing from the dropdown menu, specific dates can be selected. Additionally, data export in Excel file format is possible through the export button.
The restaurant section allows the admin to view all the details of impaneled restaurants such as Restaurants ID, its Name, its count, and the amount generated by sales. The admin can also filter the data based on dates using the two different date filters. The admin can export this data in an Excel file format.
The pie chart section illustrates the distribution of revenue based on different categories of cuisines. This information can help the admin to pinpoint areas of high demand and achieve substantial profits conveniently. This monthly report facilitates a comparison of the admin’s revenue with that of the preceding months.