
Quickorders Knowledge Base Get Support 24/7
Analyze Complete Reports in Quickorders
The Reports section provides detailed insights into delivery operations, order timelines, and restaurant performance. This module is essential for tracking delivery efficiency, analyzing wait times, and auditing revenue flow.
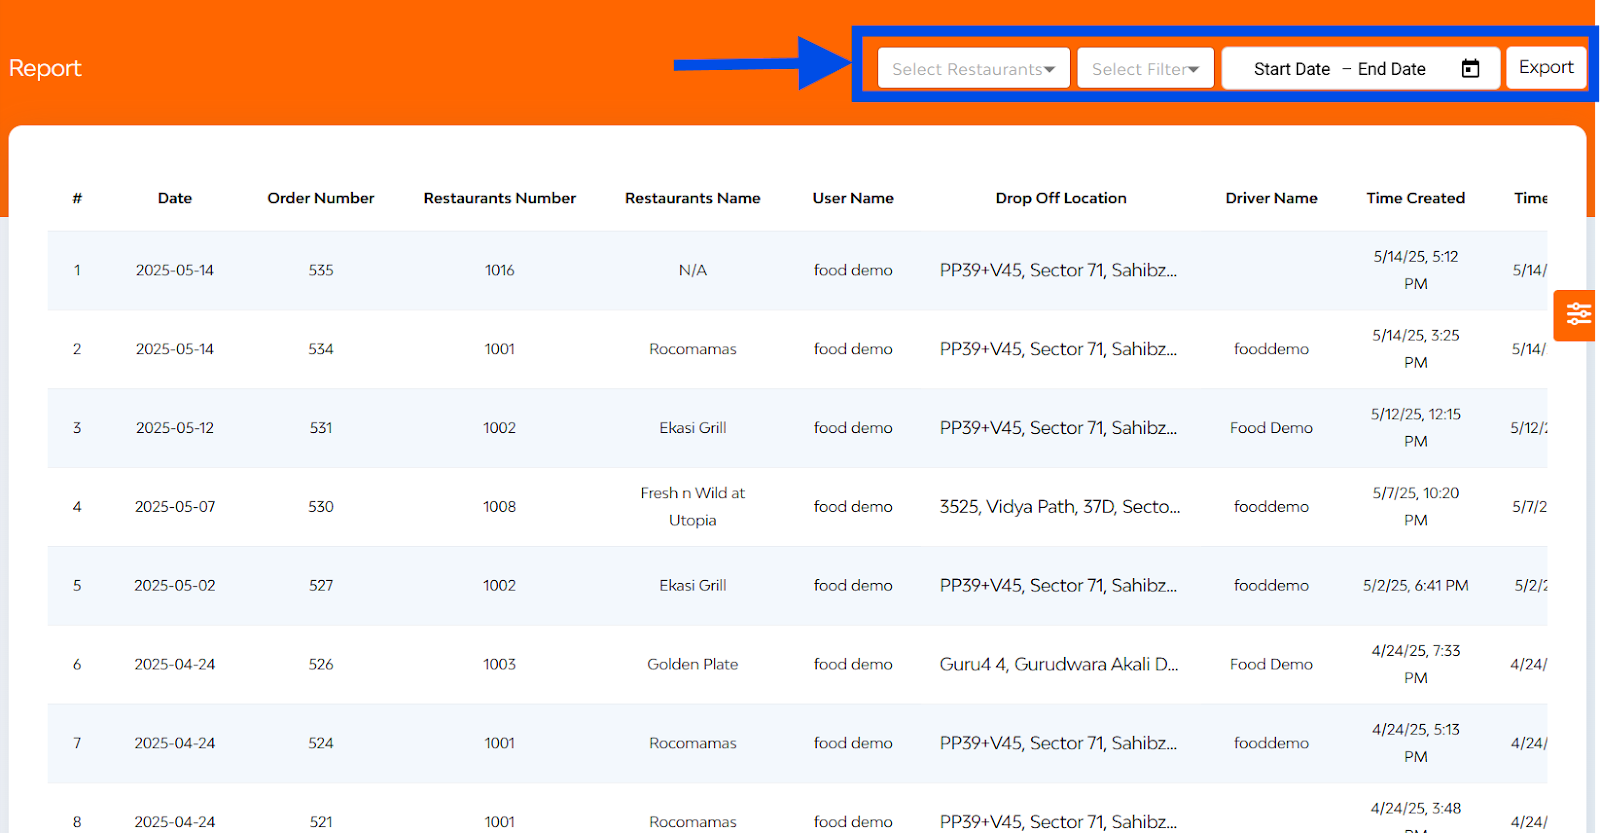
At the top-right corner of the report interface, you’ll find four powerful filtering and data tools:
- Restaurant Selector
- Quick Date Filters (Instantly filter reports using predefined ranges: Today, Last 7 Days, This Month, Last 30 Days)
- Custom Date Range Filter (Manually select any custom start and end dates to view specific data sets.)
- Export Button
The Reports interface displays a comprehensive table view with the following columns: Date, Order No., Restaurant No., Restaurant Name, User Name, Drop-off Location, Driver Name, Time Created, Time Accepted, Collection Time, Wait Duration, Pickup Time, Delivery Duration, Time Delivered, KM, Amount