Chat with us, powered by LiveChat

QuickLaundry Get Support 24/7

Sales Report

The Sales Report section offers powerful insights into the financial performance of your provider, allowing admins to evaluate revenue generation across various parameters.

Here you can get a full visual and analytical view of the business’s revenue flow, category performance, and financial trends. You can also export data for deeper analysis.

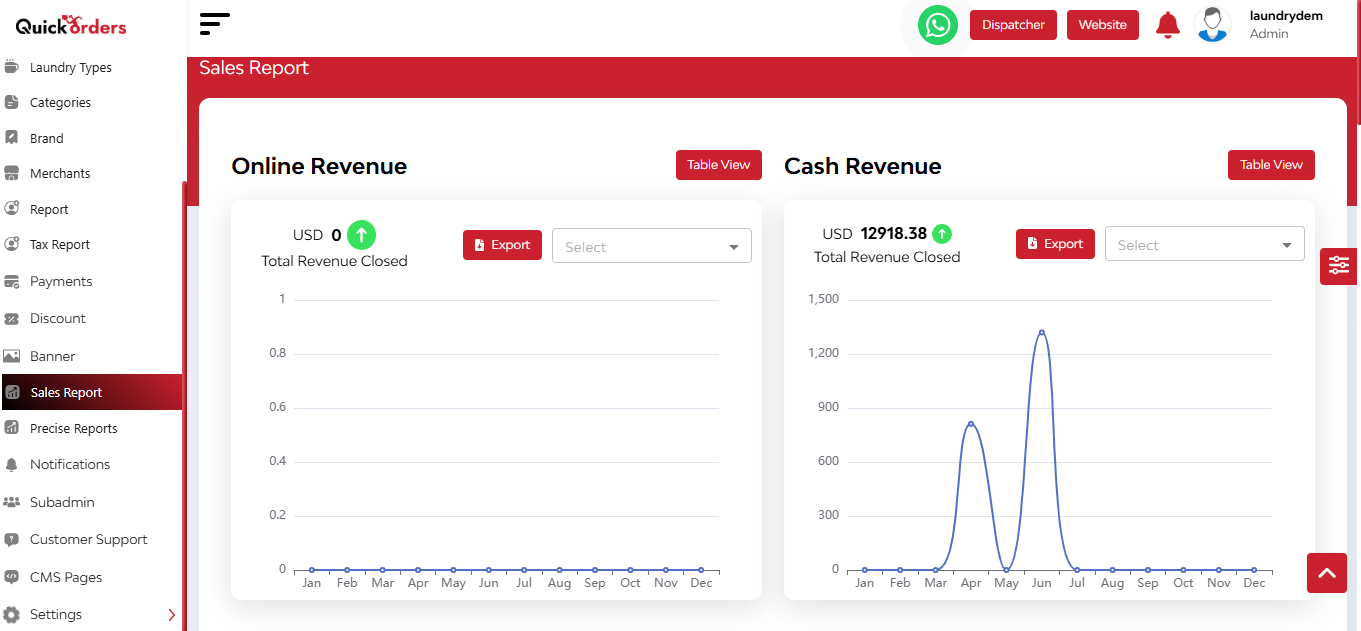
Monthly Revenue Overview (Interactive Line Chart)

  • Displays daily revenue trends over the selected month
  • Highlights income fluctuations and peak earning days
  • Switch between months to compare historical trends

After that, you can see the detailed view of the order in a tabular form based on order no, created at, admin commission, merchant commission, delivery fee, cash, and wallet.
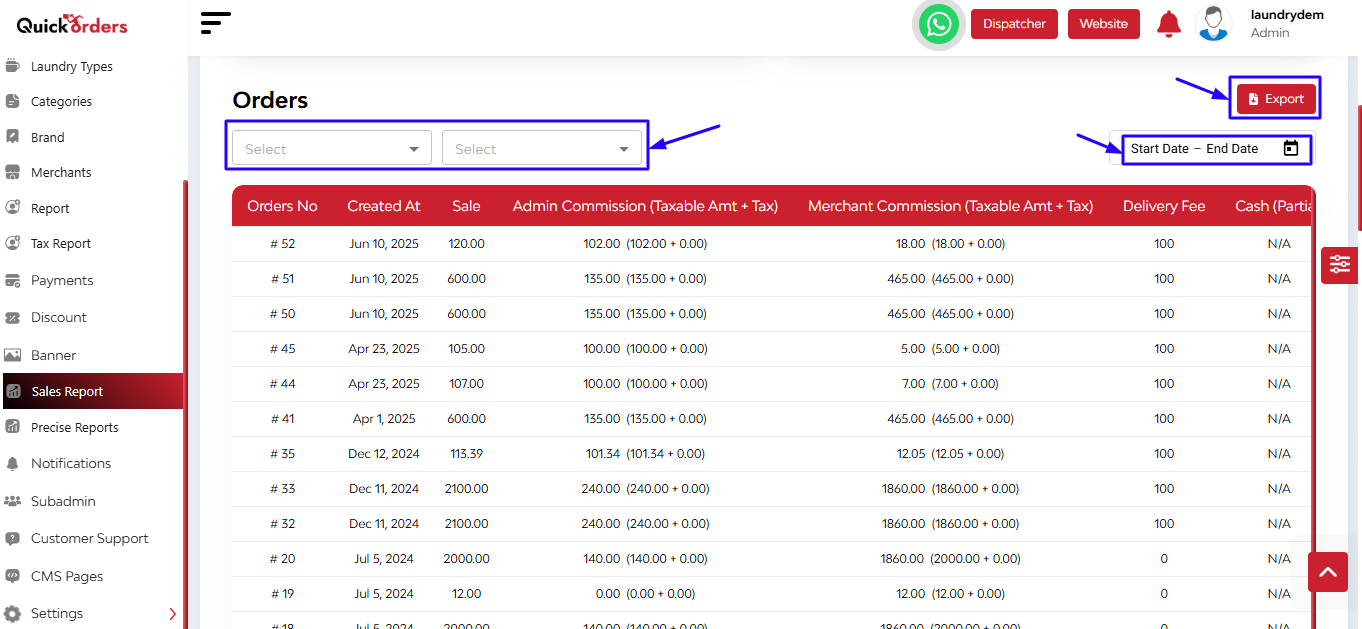
Filter Options

  • Select Time Frame: Daily, Monthly, Quarterly, Yearly
  • Select Merchants
  • Set Date Range
  • Export all filtered data

Category & Sub-Category Analysis


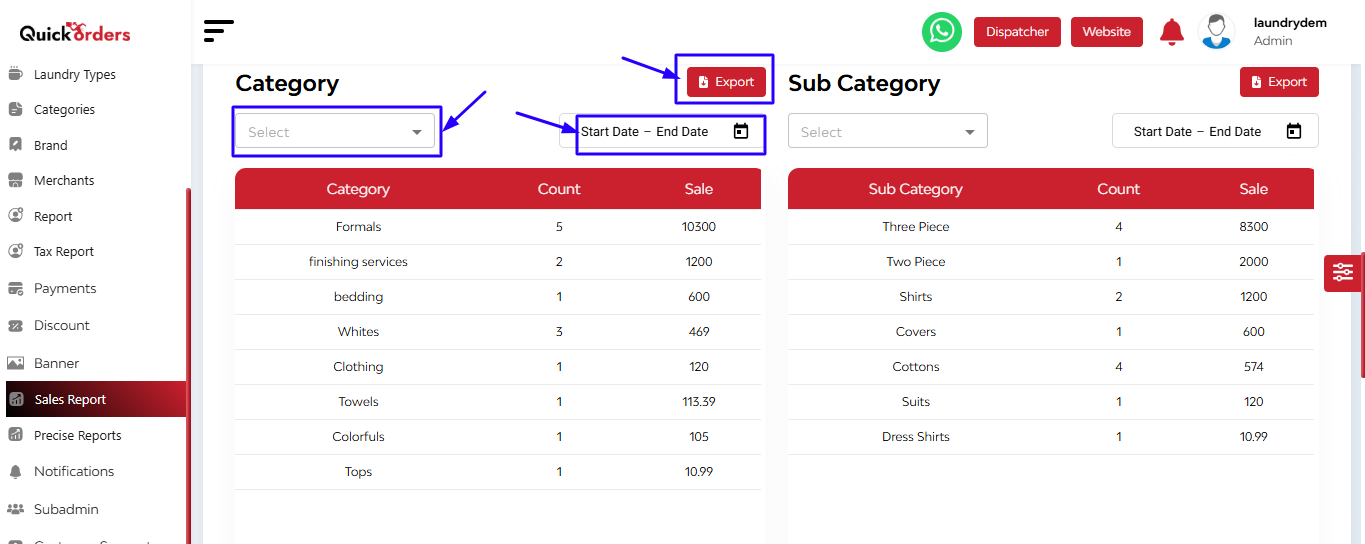
You can also check the detailed report on the basis of category and sub-category, merchants and products. Put the time frame and date range filter and get the detailed overview.

Month-Wise & Cuisine Type Breakdown

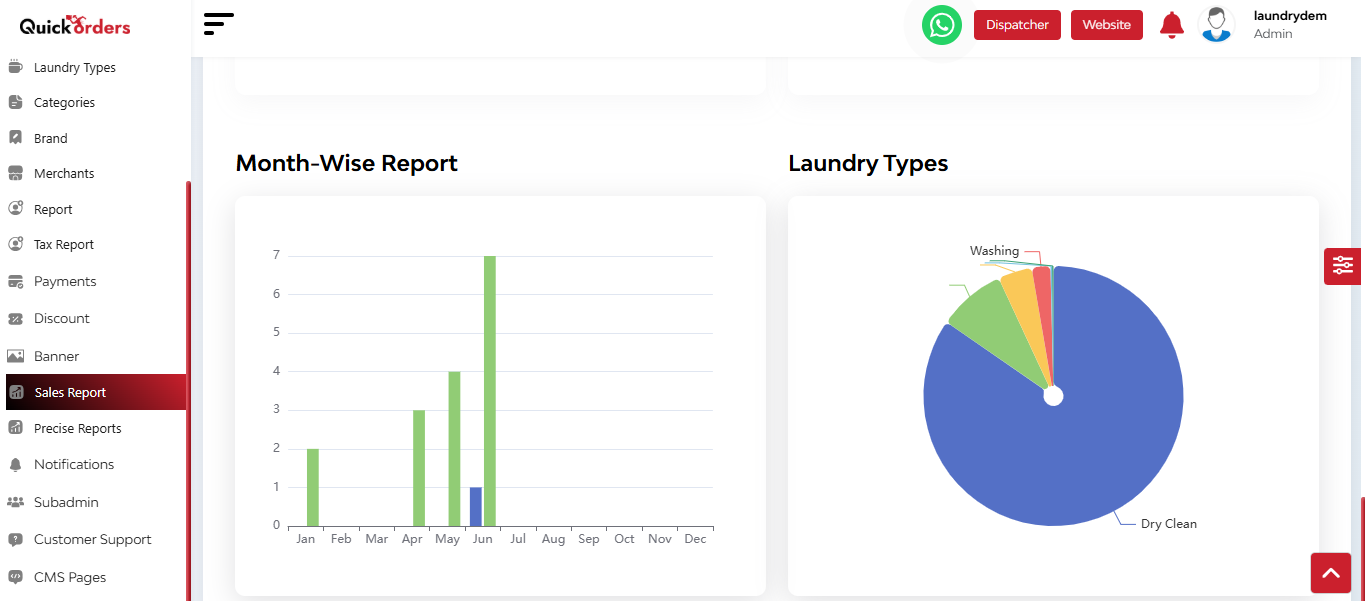
Revenue by Cuisine Types (Colour-Coded Pie Chart)
  • Visualizes income by service type
  • Helps identify which services contribute most to earnings
Monthly Income Comparison (Bar Graph Format)
  • Compares current month vs. previous month total earnings
  • Offers an at-a-glance view of financial growth or decline

FAQ's

The Sales Report module provides the admin with a detailed graphical, tabular, and list-based view of all completed orders and the overall revenue generated. It helps monitor online revenue, cash revenue, admin and merchant commissions, product and category performance, and track business trends over time.

In these sections, you can view total revenue split into online and cash payments. Each section shows a chart view to visualize trends, and you can also switch to a table view. Filters like daily, weekly, monthly, quarterly, and yearly help narrow down the data.

At multiple points in the module, there is an export button. Clicking this lets you download the filtered data—including revenue charts, order listings, category and subcategory data, merchant and product reports—into your local system for further analysis or reporting.

The order listing shows:

  • Order number
  • Creation date
  • Admin commission (taxable amount and tax)
  • Merchant commission (taxable amount and tax)
  • Delivery fees
  • Cash payments
  • Partial wallet / partial cash payments (if applicable)

This helps you track detailed financial data order by order.

If a user pays part of the amount using their wallet balance and the rest by cash, these amounts are shown separately in the partial wallet and partial cash columns. This gives a transparent view of how each order was paid.

Yes. Use the filters at the top to:

  • Select time frames (daily, weekly, monthly, quarterly, yearly)
  • Choose specific merchants from the dropdown list
  • Select custom date ranges using the calendar

This helps you drill down to exactly the data you need.

These sections show:

  • Category or subcategory name
  • Total number of products sold (count)
  • Total sales value generated

They help analyze which categories or subcategories contribute most to revenue.

It lists:

  • Merchant ID
  • Merchant name
  • Total completed orders (count)
  • Total sales value generated by each merchant

You can filter this data by date range and export it for reporting.

The product section displays:

  • Product name
  • Number of times each product was sold
  • Ratings
  • Total sales value generated

This helps identify top-performing products.

  • Month-wise reports: Visual charts showing trends in total users and orders per month.
  • Laundry type reports: Show performance of each type of merchant service on the platform, helping identify which laundry type drives the most revenue.