Chat with us, powered by LiveChat

QuickGrocery Get Support 24/7

Precise Report

A smart analytics dashboard that gives you a clear view of all your order activity, segmented by type, payment mode, and user behavior.
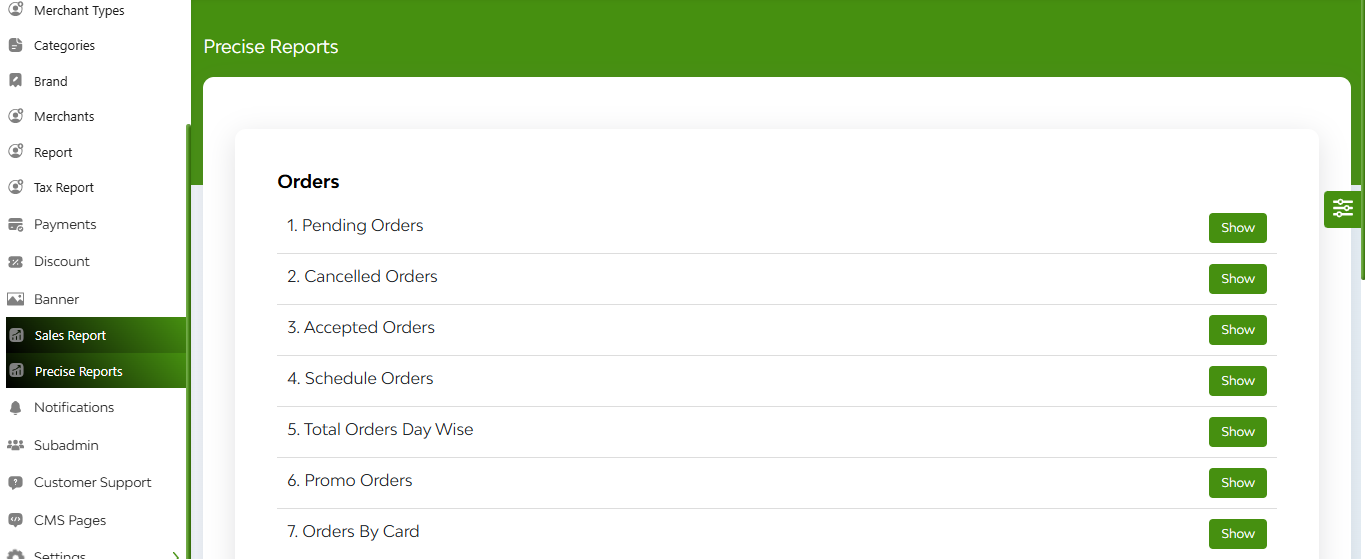
Here You’ll Find:

  • Order Categories: Pending, Cancelled, Accepted, Scheduled, Ongoing, Completed
  • Order Insights: Day-wise total orders, Promo orders, Orders by Card/Cash/Wallet
  • Cancellation Stats: Cancelled by Drivers vs. Users
  • User Breakdown: User details + individual order count

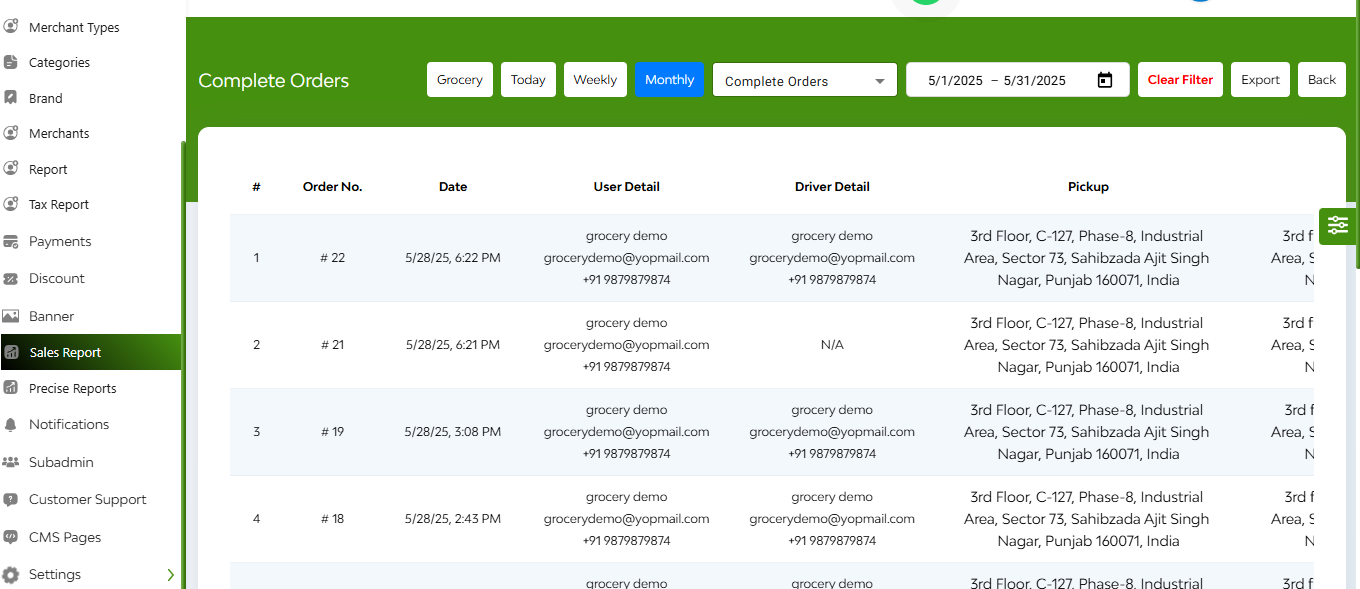
Date Filters: Filter data by Today, Weekly, or Monthly
Export Option: Download data using the top-right export tab

FAQ's

The Sales Report section provides admins with detailed insights into the platform’s business performance. It includes analytics for online and offline revenue, order breakdowns, category-wise sales, merchant contributions, and product performance.

The report tracks:

  • Online Revenue (from digital payments)
  • Cash Revenue (from cash transactions)

Both are presented via charts and can be filtered by day, week, month, quarter, or year.

Yes. You can filter all sales data using:
Predefined ranges (daily, weekly, monthly, quarterly, yearly)

Custom date ranges by selecting start and end dates

Yes. All chart and table data—whether related to orders, merchants, products, or revenue—can be exported to your local system using the Export button.

Each order entry includes:

  • Order Date
  • Admin Commission
  • Merchant Commission
  • Delivery Fee
  • Payment Mode (cash, wallet)
  • Order Total

You can filter this list by merchant type or by date.

  • Yes. Under the Merchant section, the report shows:
    Merchant ID and Name
  • Total number of orders per merchant
  • Associated sales revenue

This helps track top-performing merchants.

It shows:

  • Product Name
  • Number of units sold
  • Ratings given by customers
  • Total sales generated by each product

Yes. The Monthly Verification report provides a lump-sum view of how many users placed how many orders each month, helping to monitor performance trends over time.

This interactive chart shows the distribution of orders across different merchant types, helping visualize which type of merchants are driving the most business.

Yes. The Category and Subcategory sections show:

  • Total sales
  • Count of categories/subcategories
  • Filter by daily, weekly, monthly, quarterly, yearly, or custom range

Only admins with appropriate role-based access permissions can view, filter, and export the sales report data.

Use the tab or side menu navigation to switch between:

  • Online/Cash Revenue
  • Orders
  • Categories/Subcategories
  • Merchant
  • Product
  • Monthly Report
  • Merchant Type Chart