
Quickorders Knowledge Base Get Support 24/7
Sales Report
The Sales Report section offers powerful insights into the financial performance of your food order, allowing admins to evaluate revenue generation across various parameters.
Here you can get a full visual and analytical view of the business’s revenue flow, category performance, and financial trends. Also can export data.
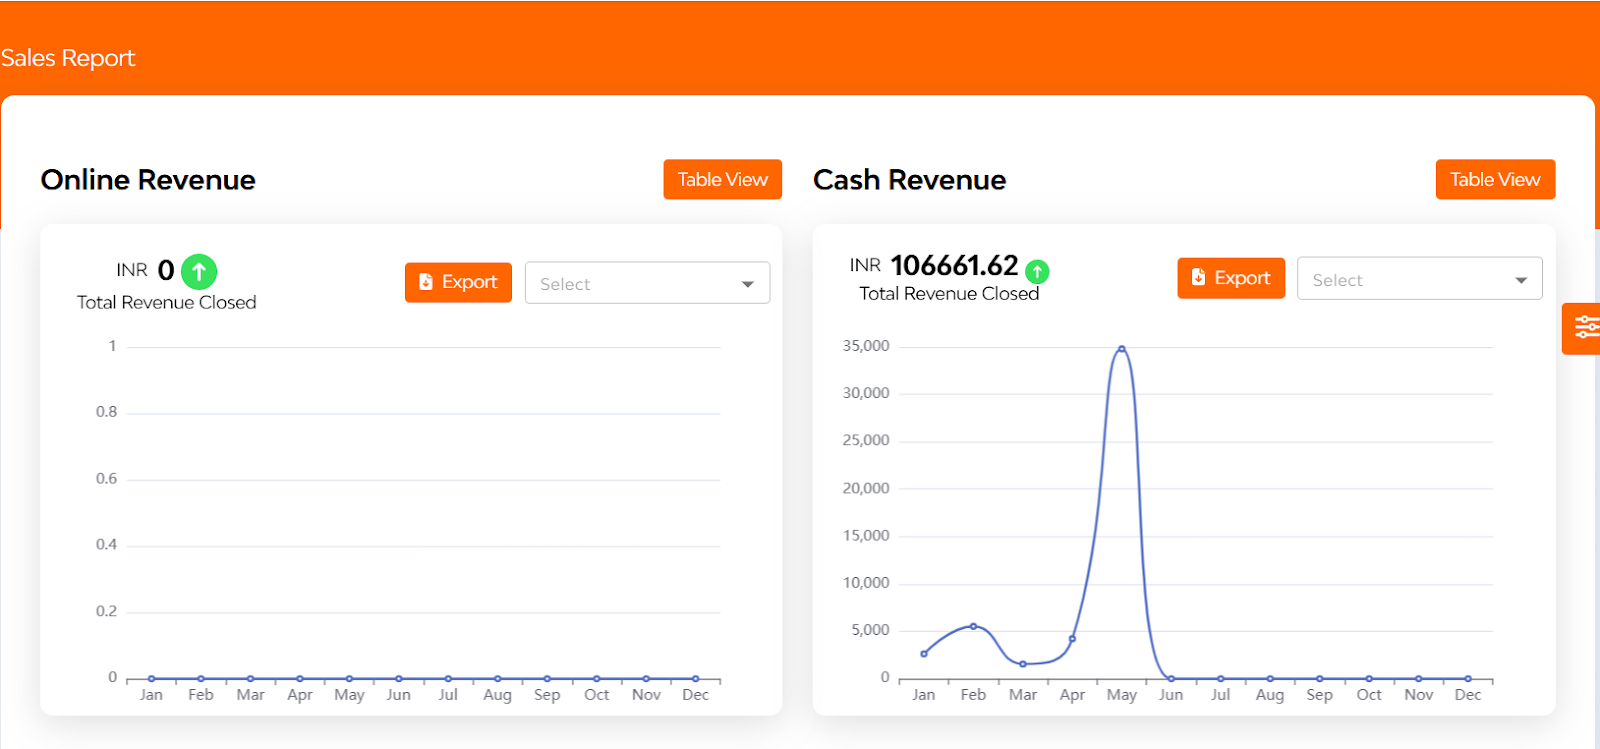
Monthly Revenue Overview (Interactive Line Chart)
- Displays daily revenue trends over the selected month.
- Highlights income fluctuations and peak earning days.
- Easily switch between months to compare historical trends.
After that, you can see the detailed view of the order in a tabular form based on order no, created at, admin commission, merchant commission, delivery fee, cash, and wallet.
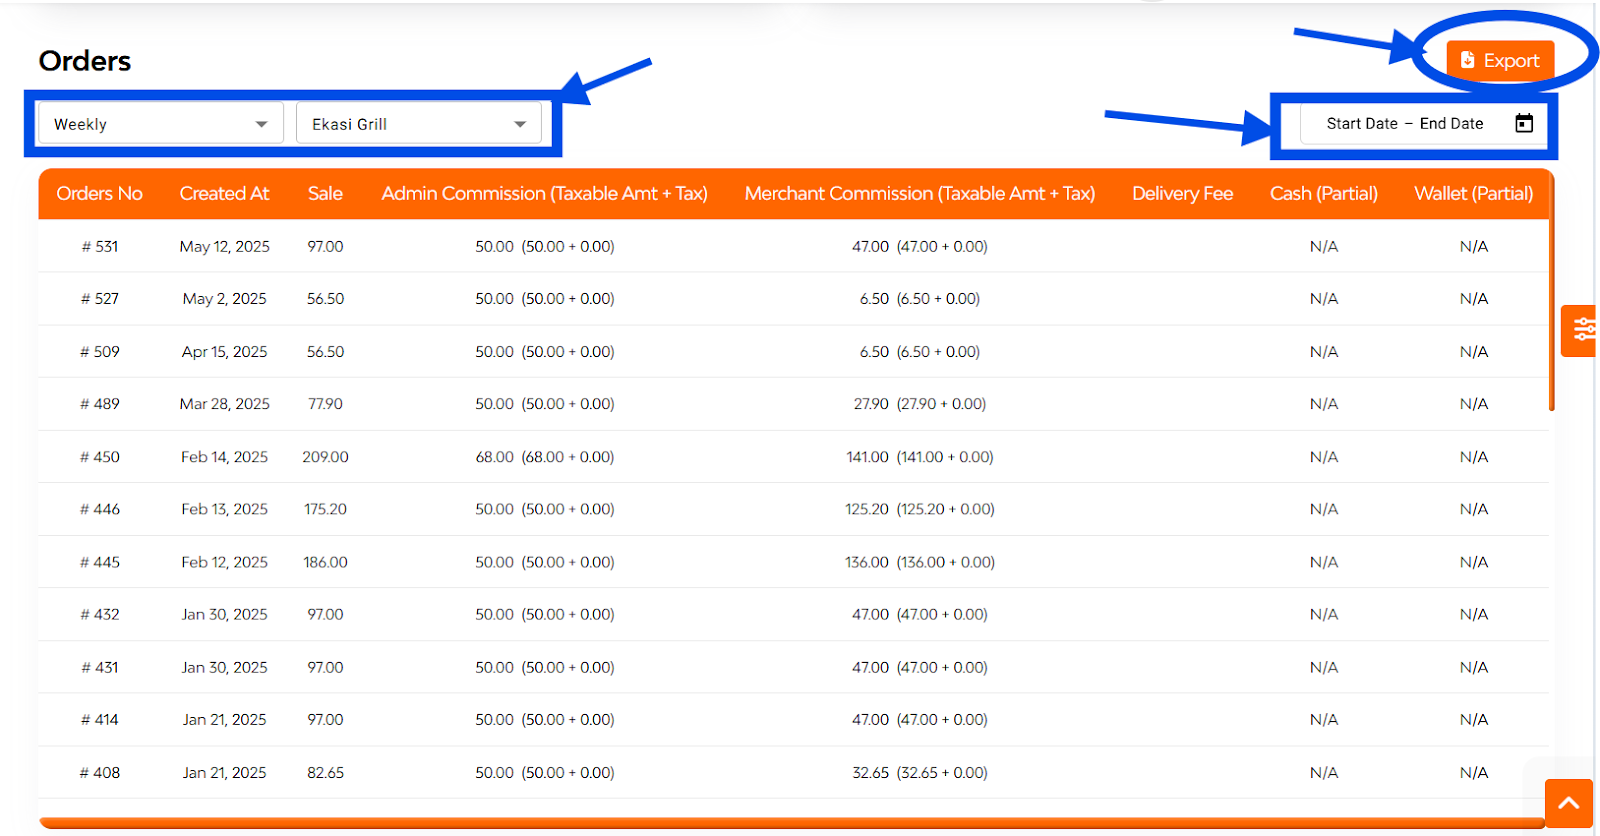
Here you can also filter the data by selecting the time frame(daily, monthly, quarterly, yearly), selecting restaurants, and setting the date range filter. And can also export all the data.
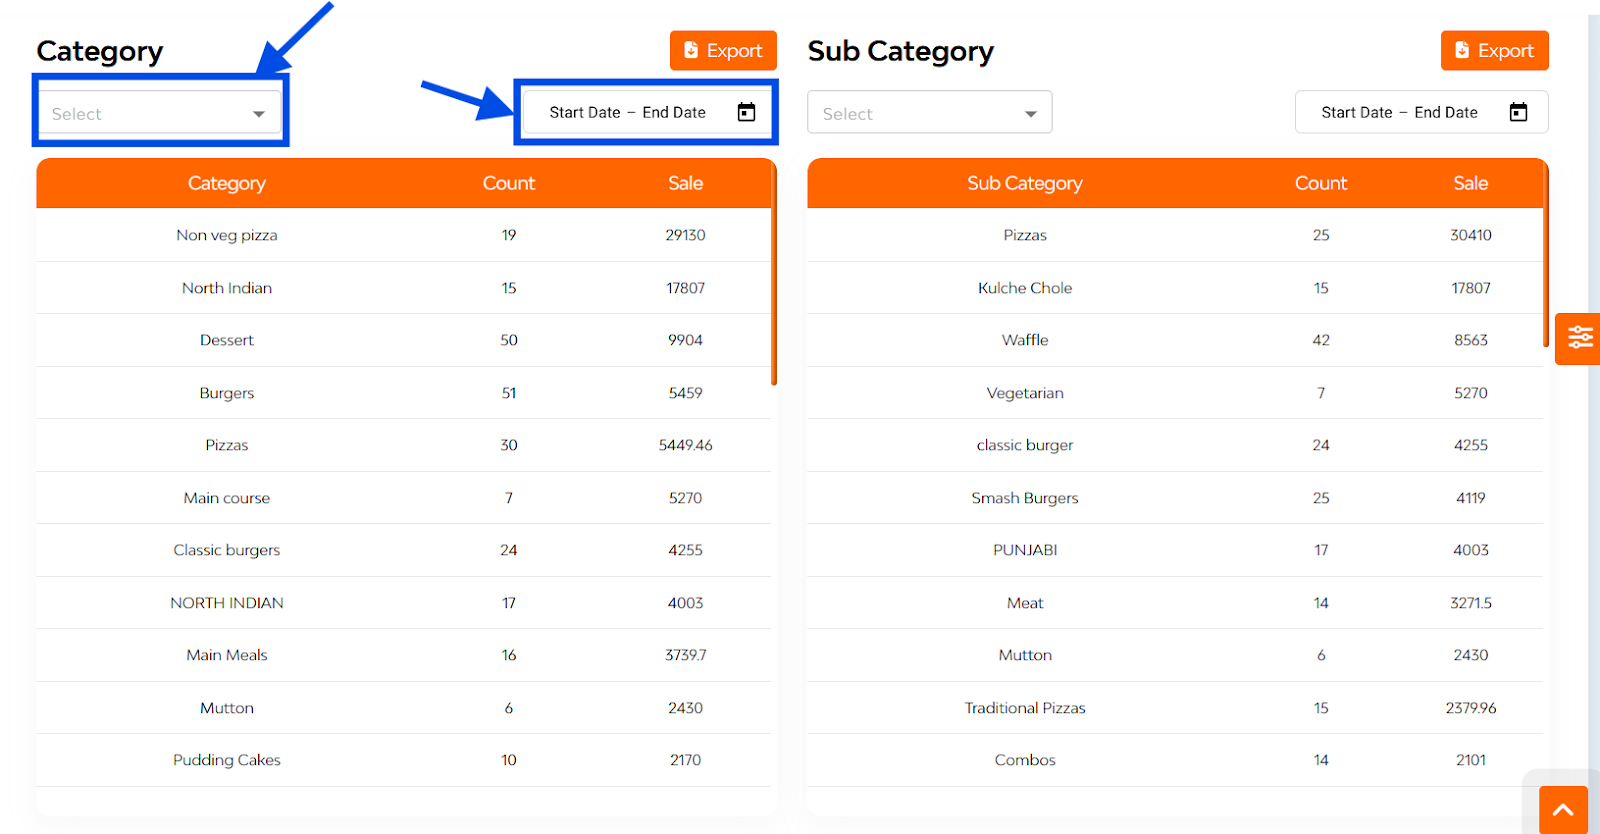
You can also check the detailed report on the basis of category and sub-category, restaurants and products. Put the time frame and date range filter and get the detailed overview.
After that analyze the data on the basis of a month-wise report and cuisine type.
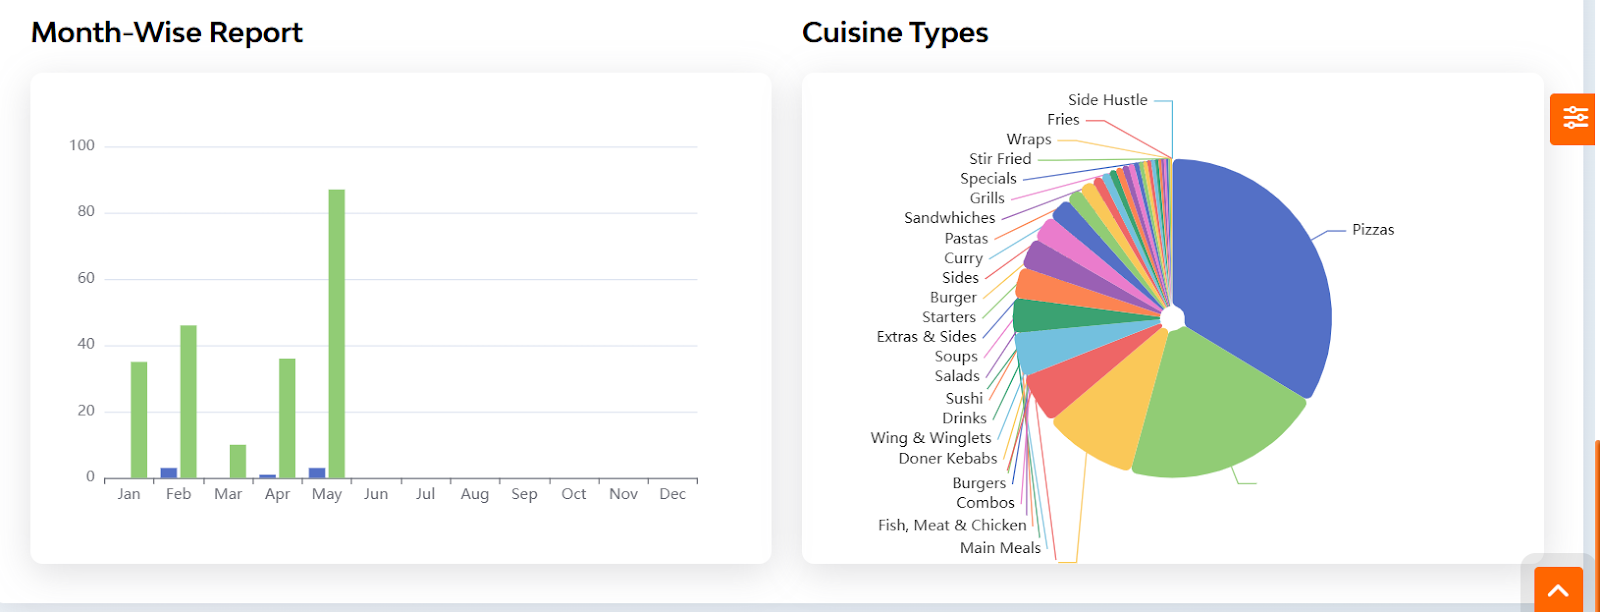
Revenue by Cuisine Types(Colour-Coded Pie Chart)
- Visualizes income by service type (e.g., Main meal, combos, burger,etc).
- Helps identify which services contribute most to earnings.
Monthly Income Comparison (Bar Graph Format)
- Compares current month vs. previous month total earnings.
- Offers an at-a-glance view of financial growth or decline.